The Art and Science of Business Analysis: Navigating the Financial World
The world of finance can often seem like a labyrinth of technical jargon and endless numbers. However, at its core, analyzing a company is simply about trying to understand the story those numbers tell. Finance allows us to separate the management team's optimistic narrative from the raw, tangible reality of the business.
To invest, partner, or simply understand how a company operates, we need tools that help us read that story. Here is a breakdown of the fundamentals and the most effective analysis models, formatted specifically so you can easily organize it in your Notion workspace.
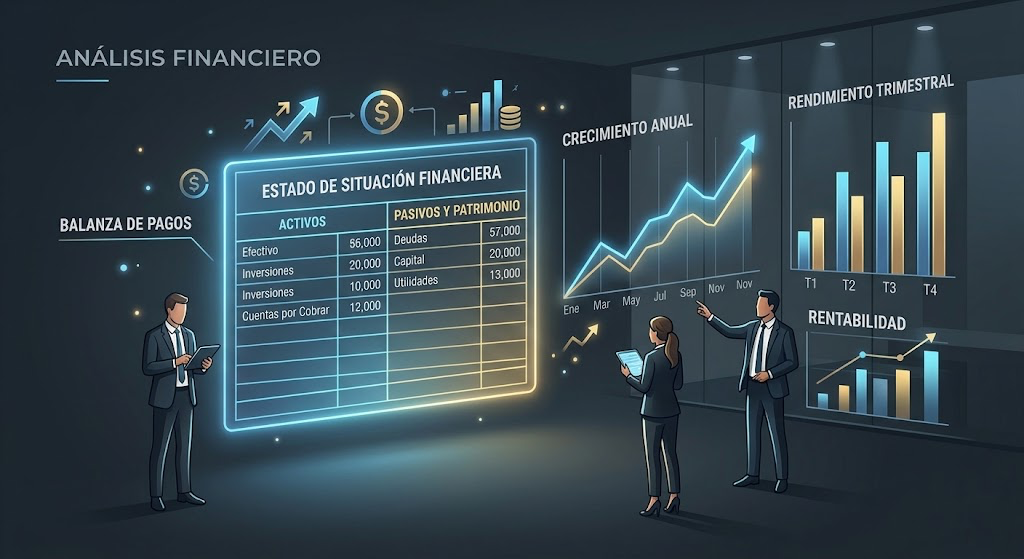
The Foundation: The "Trinity" of Financial Statements
Before applying any complex model, it is essential to understand where the data comes from. Every company tells its economic story through three key documents:
- Balance Sheet: This is an x-ray of the company at an exact moment in time. It shows what the company owns(Assets), what it owes (Liabilities), and what belongs to the owners (Shareholders' Equity).
- Income Statement (Profit and Loss): This is a motion picture of what has happened over a period (a quarter, a year). It details revenues, subtracts expenses, and tells us if the company has made or lost money.
- Cash Flow Statement: This is the ultimate lie detector. A company can report accounting profits, but if it doesn't generate actual cash, it won't be able to pay its payroll or its debts. It shows exactly the money moving in and out of the bank.
Financial Analysis Models: How Do We Value a Company?
There is no crystal ball, but there are mathematical and interpretative models that bring us closer to the reality of a business's value. These are the most widely used models by professional analysts and investors.
- Discounted Cash Flow (DCF) Model
Considered the gold standard in intrinsic valuation, the DCF premise is straightforward: a company is worth today exactly the amount of cash it will generate in the future, discounted back to its present value (because money today is worth more than money tomorrow due to inflation and opportunity cost).
Its mathematical representation is as follows:
Where CFt is the projected cash flow for year t, and r is the discount rate (the risk or required rate of return). While theoretically the most accurate model, it is extremely sensitive to predictions: if you estimate the future incorrectly, the result will be flawed.
- DuPont Analysis
Created by the DuPont Corporation in the 1920s, this model does not try to calculate a stock price, but rather understand why a company is profitable. It breaks down the Return on Equity (ROE) into three key components, allowing the analyst to see if profitability comes from high margins, moving inventory quickly, or simply taking on heavy debt.
These three multipliers represent:
- Net Profit Margin: The ability to convert sales into profits.
- Asset Turnover: Efficiency in using assets to generate sales.
- Financial Leverage: The level of debt used to finance those assets.
- Valuation by Multiples (Relative Analysis)
Instead of looking inward at the company in a vacuum, this model compares the company with its market competitors. It is like pricing a house by looking at how much the neighbors' houses sold for.
- P/E Ratio (Price-to-Earnings): Relates the stock price to the earnings per share. A P/E of 15 means you are paying 1 of annual profit.
- EV/EBITDA: Measures the total value of the company (Enterprise Value, including debt) against its operating earnings before interest, taxes, depreciation, and amortization. It is ideal for comparing companies with different debt structures.
Model Comparison Matrix
| Model | What does it answer? | Key Advantages | Disadvantages / Risks |
|---|---|---|---|
| DCF | What is the real (intrinsic) value of the company? | Based on actual cash, ignoring temporary market fads. | Highly sensitive to future projections (garbage in, garbage out). |
| DuPont | Where exactly does the business's profitability come from? | Detects if a high ROE is real or just the result of excessive debt. | Based on past accounting data; does not predict the future. |
| Multiples | Is it cheap or expensive compared to its sector? | Quick to calculate and reflects current market sentiment. | If the whole sector is overvalued (a bubble), it gives a false sense of security. |
The Analyst's Reality Check: No model is perfect or works in isolation. The best financial analysis is always a combination of several approaches. Use DCF to understand intrinsic value, Multiples to take the current market's temperature, and the DuPont model to confirm that the business's operational foundations are solid and not a debt-fueled mirage.